

Why smart lenders are shifting from volume to unit economics—and how automation makes it possible
By Thomas Rasmuson, Enterprise Sales Account Executive for Mortgage at Argyle
It seems the mortgage industry is finally emerging from years of losses. According to the Mortgage Bankers Association (MBA), independent mortgage banks posted an average profit of $443 per loan in 2024—a welcome change after losing $1,056 per loan in 2023.
But here’s what should concern every lender: that profit margin represents just 10 basis points. For context, the historical average since 2008 has been +47 basis points, or $1,077 per loan.
In other words, we’re not out of the woods quite yet. Still, as I meet with mortgage executives across the country, I’m seeing a critical shift in how the best performers think about their business. They’re done chasing volume for volume’s sake and are instead laser-focused on a metric that will separate the winners from the stragglers in 2026: cost per loan.
Below, I explore why prioritizing unit economics over volume has become essential, how automation is transforming mortgage cost structures, and what practical steps forward-thinking lenders can take to build a more sustainable competitive edge.
Sunsetting the volume playbook
To begin, let’s be honest about what happened. When rates were low and refinancing waves were rolling, many lenders built operations designed for volume. More loans meant more revenue, and the math worked, even if individual loan returns were mediocre.
But that playbook is dead.
MBA forecasts suggest origination volumes will grow 28.5% through 2025, reaching $2.3 trillion in total. And that sounds promising—until you consider that, even with this growth, we’re still operating in a purchase-dominated market with far less volume than the refi boom. The MBA data shows that total loan production expenses remained stubbornly high at $11,076 per loan in 2024, down only $182 from 2023 despite improved volumes.
Meanwhile, costs keep climbing. Credit reporting expenses alone are rising at least 20% so far in 2025. Vendor costs across the board continue to increase. And smaller lenders with annual production under $500 million posted losses for the third consecutive year in 2024 as they couldn’t spread their fixed costs across enough volume.
The message is clear. Volume growth alone won’t save you if your cost structure is fundamentally broken.
Why unit economics matter now more than ever
In working with lenders of all sizes, I’ve noticed something interesting. The most sophisticated operators have stopped asking, “How many loans did we close?” as their primary success metric. Instead, they’re asking, “What did each loan cost us to produce?”
This isn’t just about accounting. Understanding your cost per loan reveals whether your business model is actually working and whether it can truly withstand market volatility. A recent MBA analysis, for example, found that production costs don’t necessarily scale linearly. The lowest balance lenders actually managed costs better during the recent downturn, with only a $1,300 variance per loan between 2021 and 2022, compared to about $1,700 for higher balance groups—proving you can’t simply rely on bigger loans or higher volumes to solve underlying efficiency problems.
The lenders who dominate in 2026 will understand that profitability comes from two levers:
- Capturing more business at the top of the funnel
- Optimizing the economics of underwriting
Both of these levers require a strong focus on operational efficiency.
Consider what happens when you don’t optimize unit economics. You end up with loan officers spending one to two hours daily answering repetitive borrower questions and chasing down documentation. Your operations team gets trapped in tiresome tasks like manually transferring data between different systems, draining morale and introducing avoidable errors and delays. Ultimately, your verification process requires multiple touches, inflating costs with each interaction.
All of this shows up in your cost per loan. And in a market where the average margin is just 10 basis points, those inefficiencies can be the difference between profit and loss.
Automation is going from buzzword to competitive necessity
Shifting from diagnosis to remedy, the lenders set up to thrive in 2026 aren’t just acknowledging the unit economics challenge. They’re actively addressing it through strategic automation investments. And, when I say “automation,” I’m not talking about some vague futuristic state. I’m talking about specific operational solutions that already exist today and can directly impact your cost structure.
Importantly, however, automation can only improve your unit economics if it addresses actual cost drivers in your operations. As a concrete, practical example, let’s consider how it applies to income, employment, and asset verifications.
Verifications: a real-world example
The verification process is a critical workflow that touches every loan. Traditional methods—whether manually calling up employers to verify work status, chasing down paystubs, or paying top dollar for verification reports from The Work Number (TWN)—all carry both hard costs and soft costs in cycle time and loan officer productivity.
Legacy database solutions like TWN often cost significantly more than $100 per report. When you’re running verifications on every loan—and often multiple verifications per borrower—those costs can add up fast. For a lender closing even 200 loans a month, that means verification report costs alone likely exceed hundreds of thousands of dollars a year using TWN.
Automating the process with direct-source verifications changes the economics completely. Modern solutions like Argyle can reduce verification costs by up to 80% compared to legacy databases, bringing per-verification costs down while simultaneously improving data quality and speed.
That’s because, when a borrower can connect their employer, payroll provider, or bank account and quickly verify their income, employment, and assets with accurate, comprehensive data, multiple things happen simultaneously:
- Your hard costs per verification drop thanks to avoiding labor-draining manual processes and expensive database reports
- Your cycle time decreases, allowing you to process more volume without increasing headcount
- Your data quality improves, minimizing downstream defects and rework
- Your borrower experience gets exponentially smoother, boosting engagement and reducing churn
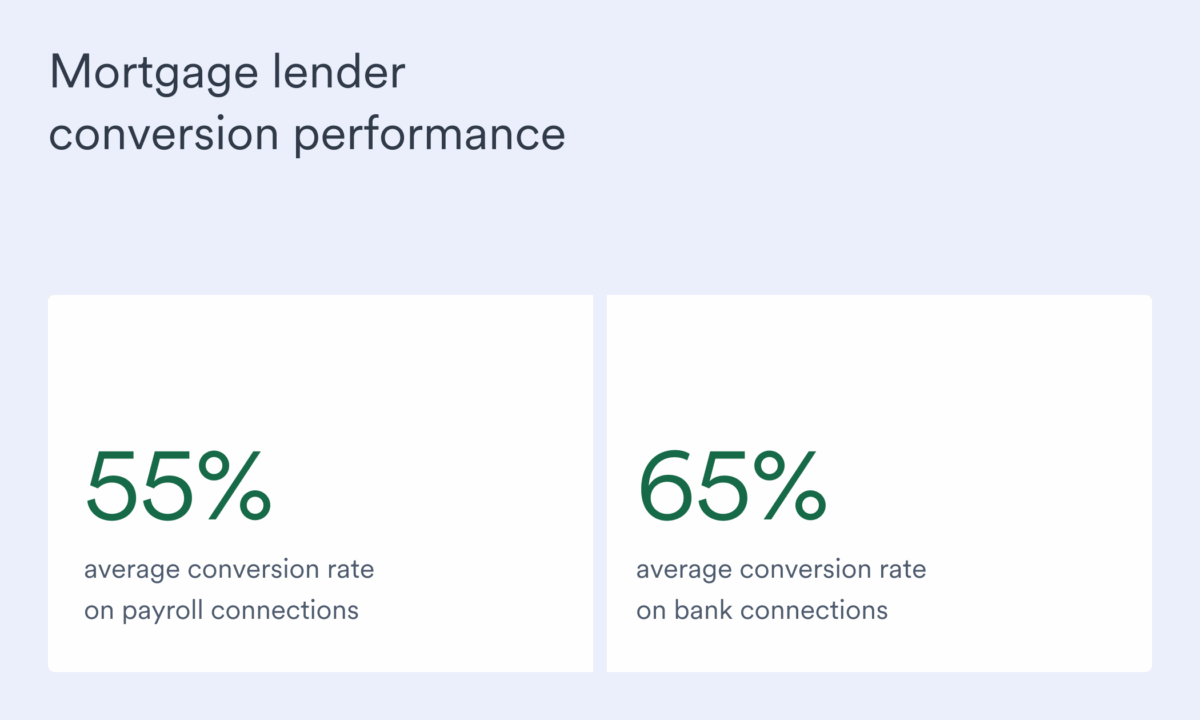
This isn’t just hypothetical. Mortgage lenders using Argyle’s direct-source verification solution consistently see conversions soar—with 55% average conversion rates on payroll connections and 65% average conversion rates on bank connections. One credit union saved up to three weeks of verification time and $100 per loan, savings they could then pass on to their members. Another mortgage lender achieved 88% cost savings per loan and 55% higher automated verification volumes compared to alternative providers.
The integration factor nobody talks about
One thing about automation that most vendors won’t tell you is, it works much better if it fits into your existing workflow and tech stack. I’ve seen too many mortgage lenders buy “cutting-edge” technology that then sits on a shelf because it still requires manual data transfers between isolated systems.
That’s not automation. That’s just shuffling inefficiencies around.
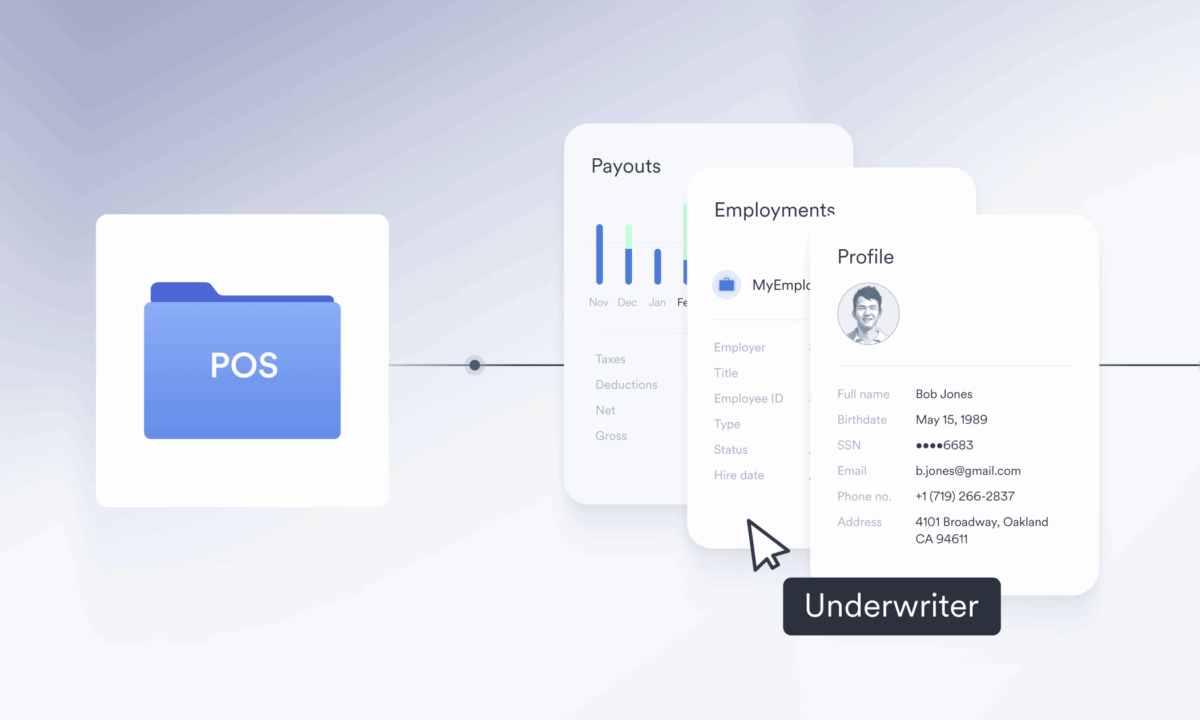
The mortgage industry operates on complex ecosystems including point-of-sale (POS) systems, loan origination systems (LOS), and automated underwriting engines. Effective automation needs to integrate seamlessly across this stack, creating a smooth flow of data from initial application straight through closing.
When verification data flows from a POS like nCino or Consumer Connect directly into an LOS like Encompass, loan officers aren’t rekeying information. URLAs are automatically prepopulated with accurate, pre-verified income data. And underwriters have immediate, unfettered access to complete verification reports. That end-to-end integration is what actually drives down your cost per loan and compounds into a dramatically different cost structure.
What best-in-class lenders are doing differently
In my conversations with top-performing lenders, I’ve noticed some common patterns in the way they approach operational efficiency—best practices that their peers can and should adopt:
- They’re measuring everything. Leading lenders know their cost per loan broken down by loan officer, branch, and product type. They track where manual touches occur in their workflow and what each touch costs.
- They’re being strategic about tech investments. Instead of chasing every shiny new tool and trend, top lenders identify their highest-cost pain points and tackle those first with proven solutions. Often, that means starting with complex workflows like verifications that touch every single loan. They’re also getting smarter about pricing, questioning whether they’re overpaying for legacy solutions like TWN with more cost-effective alternatives on the market.
- They’re thinking about fixed versus variable costs. In a purchase market with less predictable volume, having costs that scale along with loan production matters. The ability to convert fixed costs into variable costs through automation provides vital flexibility.
- They’re not just automating but redesigning workflows. The best automation projects don’t just speed up existing, imperfect processes. They eliminate unnecessary steps entirely.
These are practical operational changes that immediately impact the bottom line, allowing early-adopting lenders to post healthy margins while their competitors struggle.
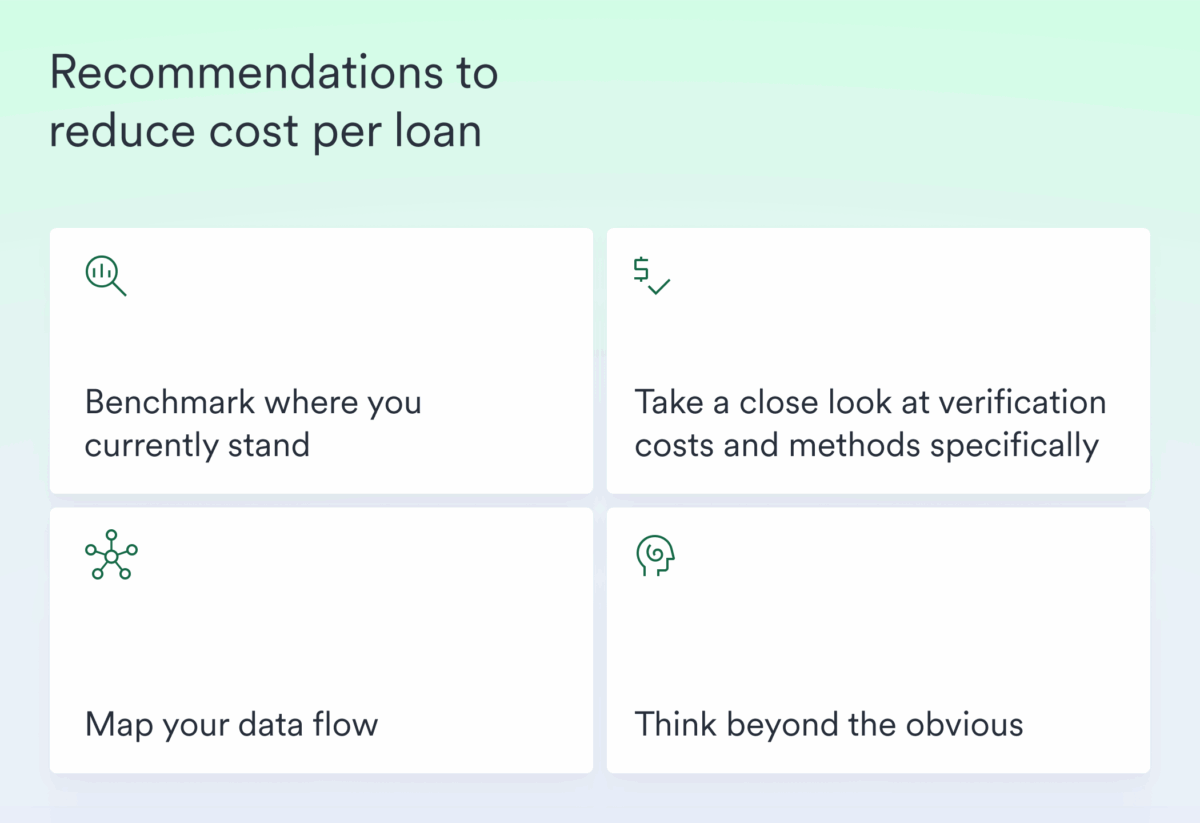
A practical path forward
If you’re reading this and thinking you need to get serious about your cost per loan, here’s where I’d recommend you start:
- Benchmark where you currently stand. If you don’t know your all-in cost per loan (including any allocated overhead), you can’t improve it. MBA performance data suggests the industry average was around $11,076 in 2024, but keep in mind that can vary significantly by lender size and model.
- Take a close look at verification costs and methods specifically. This is often the quickest and easiest win because verifications touch every loan and directly impact both costs and cycle times. Calculate what you’re actually spending on income and employment verifications per loan, including database fees, operational efforts, and rework expenses. Then, ask yourself, is it worth paying for (often multiple) static verification reports and/or manually requesting and processing documents, or is it time to move on to the sort of automated, direct-source verifications that can make a difference?
- Map your data flow. Every time information needs to be manually moved from one system to another, you’re hemorrhaging time and money. Real automation means flowing data seamlessly from your POS to your LOS to your AUS without human intervention.
- Think beyond the obvious. Yes, you should reduce headcount where and when appropriate. But a more sustainable approach is to automate repetitive, time-consuming processes so your people can focus on strategic, judgment-based tasks that actually require human expertise—like handling complex borrower situations or building and growing referral partner relationships.
Volume might return, but efficiency is forever
I’m optimistic about the coming years and expect that lower rates should support higher volumes. But my prediction is that the lenders who survive the next cycle won’t be the ones who simply waited for volume to bail them out.
They’ll be the ones who used this challenging period to restructure their operations around better unit economics, fully embraced automation as a practical cost-busting tool rather than the latest buzzword, and integrated their tech stack so tightly that every loan now flows through their system faster and cheaper than their competitors.
Because when the next downturn comes—and, let’s face it, it will—having a cost structure that works at any volume level is the only sustainable competitive advantage.
That’s why I say the metric that will define 2026 isn’t how many loans you close, it’s how efficiently you close them. Cost per loan is the KPI that separates businesses built to last from those just hoping to survive until the next refi wave. Which one are you building?
Ready to revisit your verification costs?
Argyle’s direct-source income, employment, and asset verification platform integrates seamlessly with leading POS and LOS systems to reduce costs, accelerate cycle times, and improve data quality.Get in touch with our team to learn how we’re helping lenders optimize their operations.